ggplot2 를 이용한 예쁜 forest plot 만들기
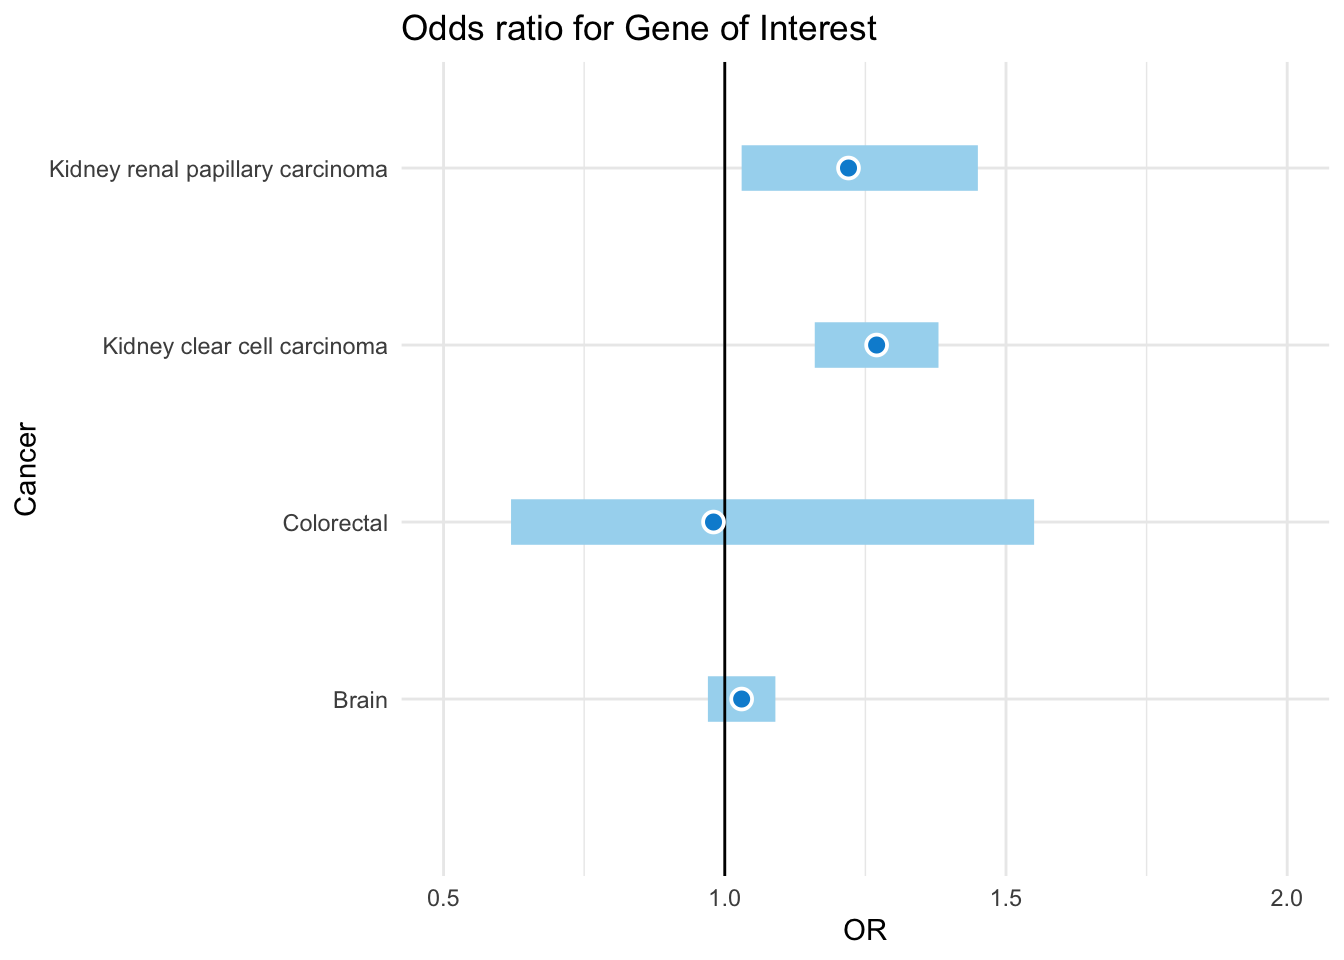
df_data <- data.frame(Cancer=c("Brain", "Colorectal", "Kidney clear cell carcinoma", "Kidney renal papillary carcinoma"),
                      OR=c(1.03, 0.98, 1.27, 1.22),
                      OR_lower=c(0.97, 0.62, 1.16, 1.03),
                      OR_upper=c(1.09, 1.55, 1.38, 1.45)
                      )

### Visualize

if (!require('ggplot2')) install.packages('ggplot2'); library('ggplot2')   # Load ggplot2 library


p <- ggplot(df_data, aes(x=Cancer, y=OR, ymin=OR_lower, ymax=OR_upper)) +
  geom_linerange(size=8, colour="#a6d8f0") +
  geom_hline(aes(x=0, yintercept=1), lty=1) +
  geom_point(size=3, shape=21, fill="#008fd5", colour = "white", stroke = 1) +
  scale_y_continuous(limits = c(0.5, 2)) +
  coord_flip() +
  ggtitle("Odds ratio for Gene of Interest") +
  theme_minimal()
p
Back to top