R mlr3 w/ ChatGPT
feat. mlr3
Yeonhoon Jang
Contents
- Introduction
- Design & Syntax
- Basic modeling
- Resampling
- Benchmarking
- ML pipeline
Introduction
Who am I?
- Graduate School of Public Health, SNU
- Seoul National University Bundang Hospital
- Data (NHIS, MIMIC-IV, CDW, Registry data, KNHNAES …)
ML in R


What is mlr3?
mlr3: Machine Learning in R 3

mlr3 & mlr3verse
Why choose mlr3?
National Health Insurance System Data (NHIS-HEALS, NHIS-NSC)
dplyr\(\rightarrow\)data.tablePython:scikit-learn=R:??mlr3:data.tablebased package
Design & Syntax
mlr3 vs tidymodels
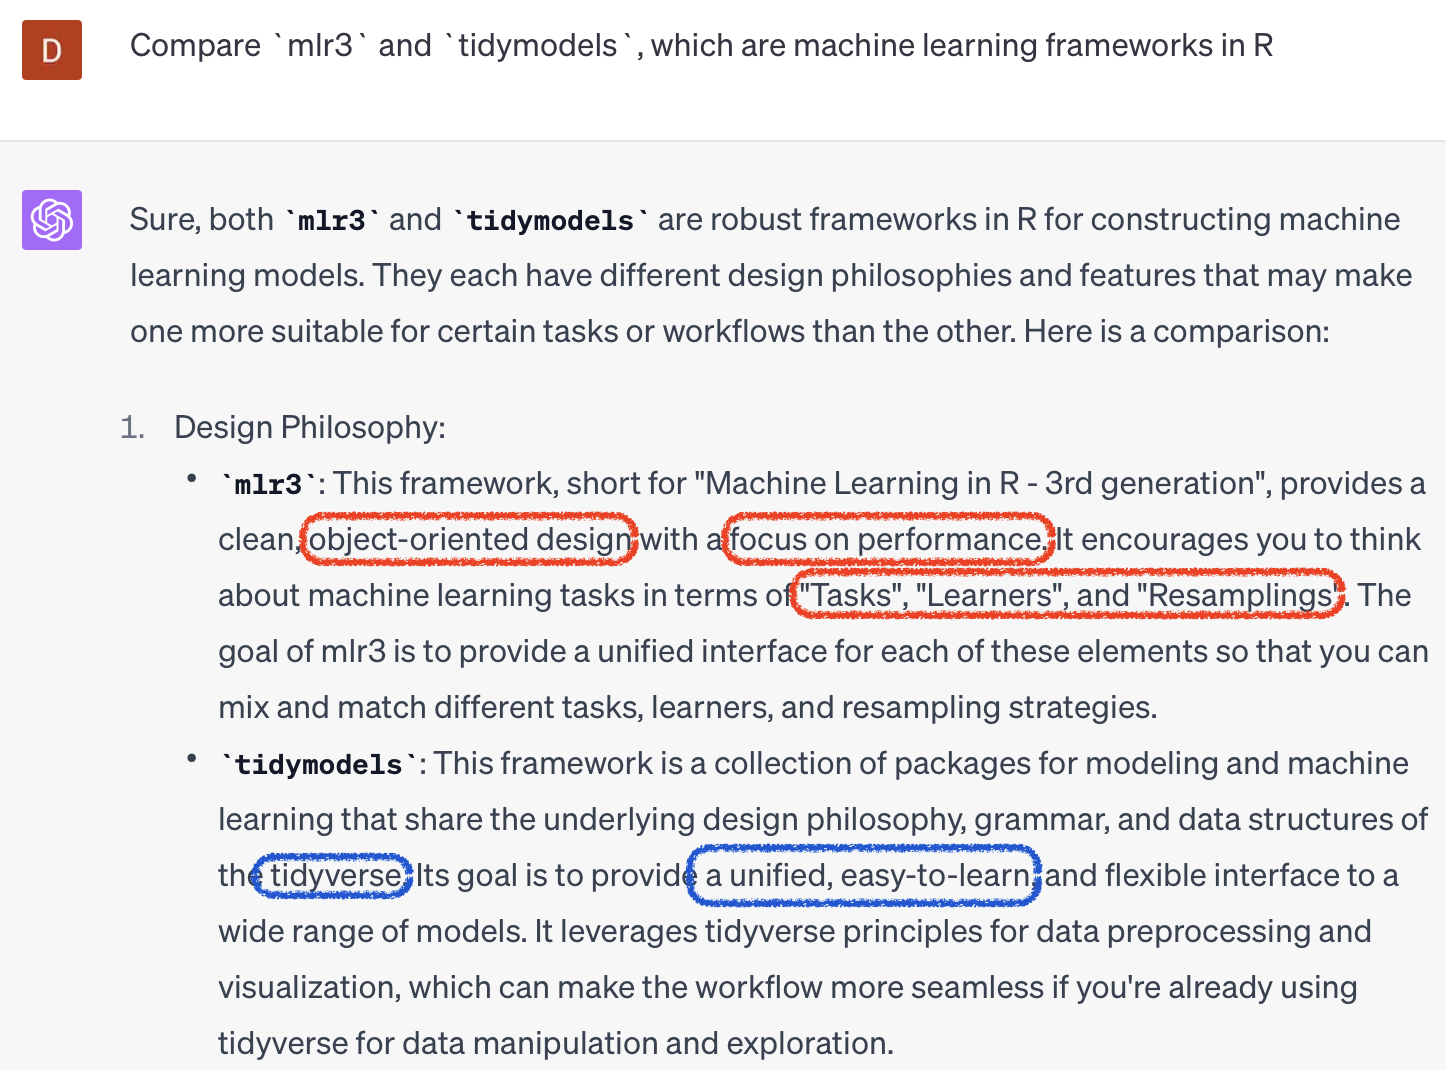
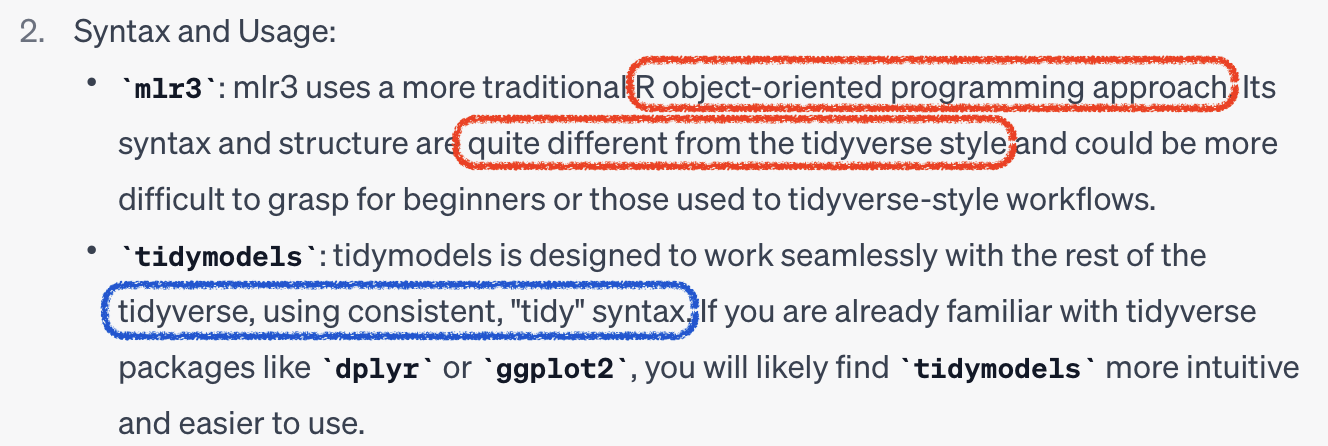
Core 1. R6
Object Oriented Programming (OOP)
- Objects:
foo = bar$new() - Methods:
$new() - Fields:
$baz
Core 2. data.table

Utils 1. Dictionary
<LearnerRegrRpart:regr.rpart>: Regression Tree
* Model: -
* Parameters: xval=0
* Packages: mlr3, rpart
* Predict Types:  [response]
* Feature Types: logical, integer, numeric, factor, ordered
* Properties: importance, missings, selected_features, weights
Utils 1. Dictionary
Utils 1. Dictionary
# A tibble: 6 × 7
  key            label task_type feature_types packages properties predict_types
  <chr>          <chr> <chr>     <list>        <list>   <list>     <list>
1 classif.cv_gl… <NA>  classif   <chr [3]>     <chr>    <chr [4]>  <chr [2]>
2 classif.debug  Debu… classif   <chr [6]>     <chr>    <chr [4]>  <chr [2]>
3 classif.featu… Feat… classif   <chr [7]>     <chr>    <chr [6]>  <chr [2]>
4 classif.glmnet <NA>  classif   <chr [3]>     <chr>    <chr [3]>  <chr [2]>
5 classif.kknn   <NA>  classif   <chr [5]>     <chr>    <chr [2]>  <chr [2]>
6 classif.lda    <NA>  classif   <chr [5]>     <chr>    <chr [3]>  <chr [2]>
Utils 2. Sugar functions
R6class \(\rightarrow\)S3type functions
Utils 3. mlr3viz
ggplot2,autoplot()visualization
Basic modeling
Ask ChatGPT!


1. Tasks
- Objects with data and metadata
- Default datasets
- Dictionary:
mlr_tasks - Sugar function:
tsk()
1. Tasks
Or External data as task
as_task_regr(): regressionas_task_classif(): classificationas_task_clust(): clustering
2. Learners
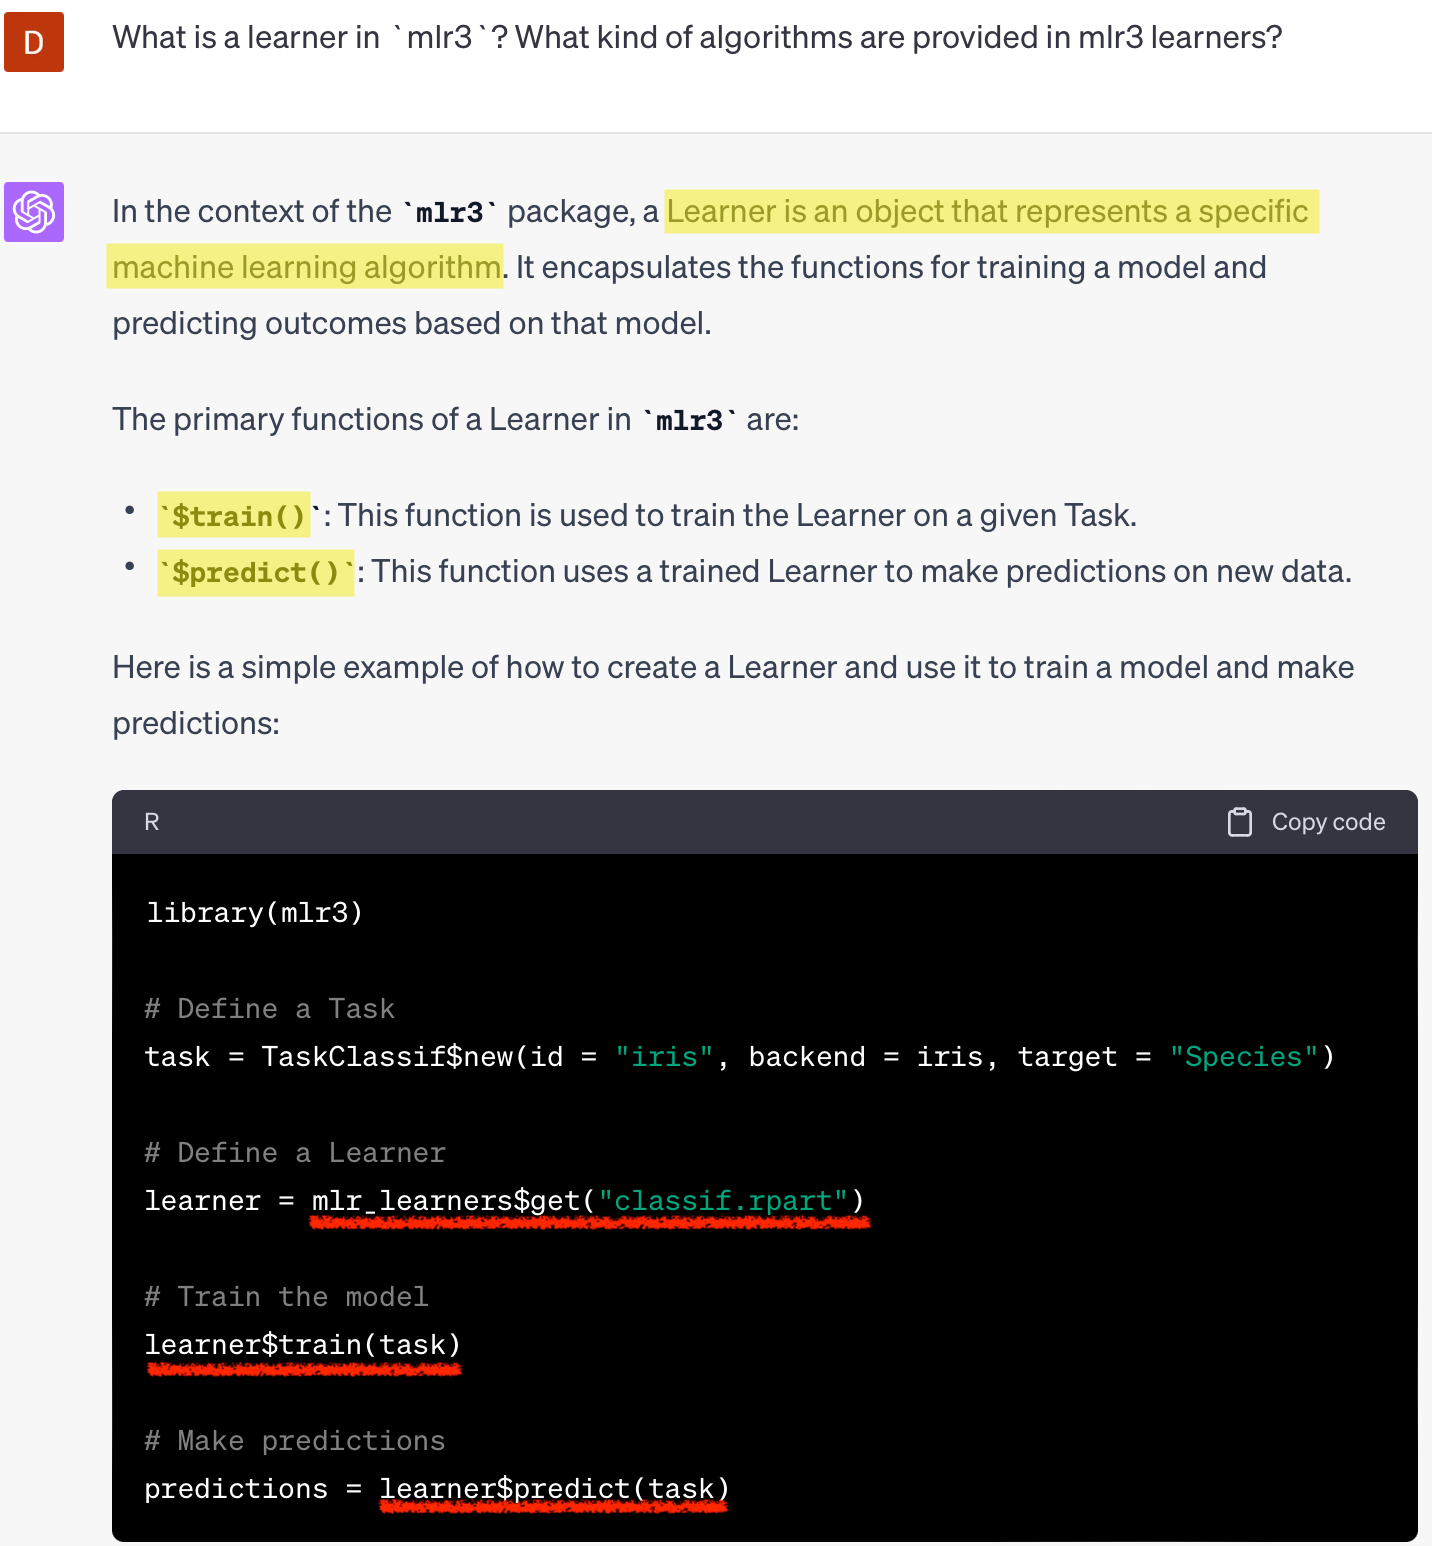
2. Learners
- ML algorithms
- Dictionary:
mlr_learners - Sugar function:
lrn() - regression (
regr.~), classification(classif.~), and clustering (clust.~) library(mlr3learners)+library(mlr3extralearners)
2. Learners
$train(),$predict()
2. Learners
confusion matrix
2. Learners
confusion matrix as a bar plot
Hyperparameter
- hyperparameter setting
Hyperparameter
$param_setof learners- setting class, lower, upper
# A tibble: 6 × 11
  id         class lower upper levels nlevels is_bounded special_vals default
  <chr>      <chr> <dbl> <dbl> <list>   <dbl> <lgl>      <list>       <list>
1 cp         Para…     0     1 <NULL>     Inf TRUE       <list [0]>   <dbl [1]>
2 keep_model Para…    NA    NA <lgl>        2 TRUE       <list [0]>   <lgl [1]>
3 maxcompete Para…     0   Inf <NULL>     Inf FALSE      <list [0]>   <int [1]>
4 maxdepth   Para…     1    30 <NULL>      30 TRUE       <list [0]>   <int [1]>
5 maxsurrog… Para…     0   Inf <NULL>     Inf FALSE      <list [0]>   <int [1]>
6 minbucket  Para…     1   Inf <NULL>     Inf FALSE      <list [0]>   <NoDefalt>
# ℹ 2 more variables: storage_type <chr>, tags <list>| Parameter class | Description |
|---|---|
ParamDbl |
Numeric parameters |
ParamInt |
Integer parameters |
ParamFct |
Categorical parameters |
ParamLgl |
Logical / Boolean paramters |
Measures
- Evaluation of performances
- Dictionary:
mlr_measures - Sugar function:
msr(),msrs() classif.~,regr.~$score()
# A tibble: 6 × 6
  key            label           task_type packages predict_type task_properties
  <chr>          <chr>           <chr>     <list>   <chr>        <list>
1 aic            Akaike Informa… <NA>      <chr>    <NA>         <chr [0]>
2 bic            Bayesian Infor… <NA>      <chr>    <NA>         <chr [0]>
3 classif.acc    Classification… classif   <chr>    response     <chr [0]>
4 classif.auc    Area Under the… classif   <chr>    prob         <chr [1]>
5 classif.bacc   Balanced Accur… classif   <chr>    response     <chr [0]>
6 classif.bbrier Binary Brier S… classif   <chr>    prob         <chr [1]>
Measures
msr(): a single performance
msrs(): multiple performances
Resampling
Resampling
- Split available data into multiple training and test sets for generalization
mlr3 vs tidymodels

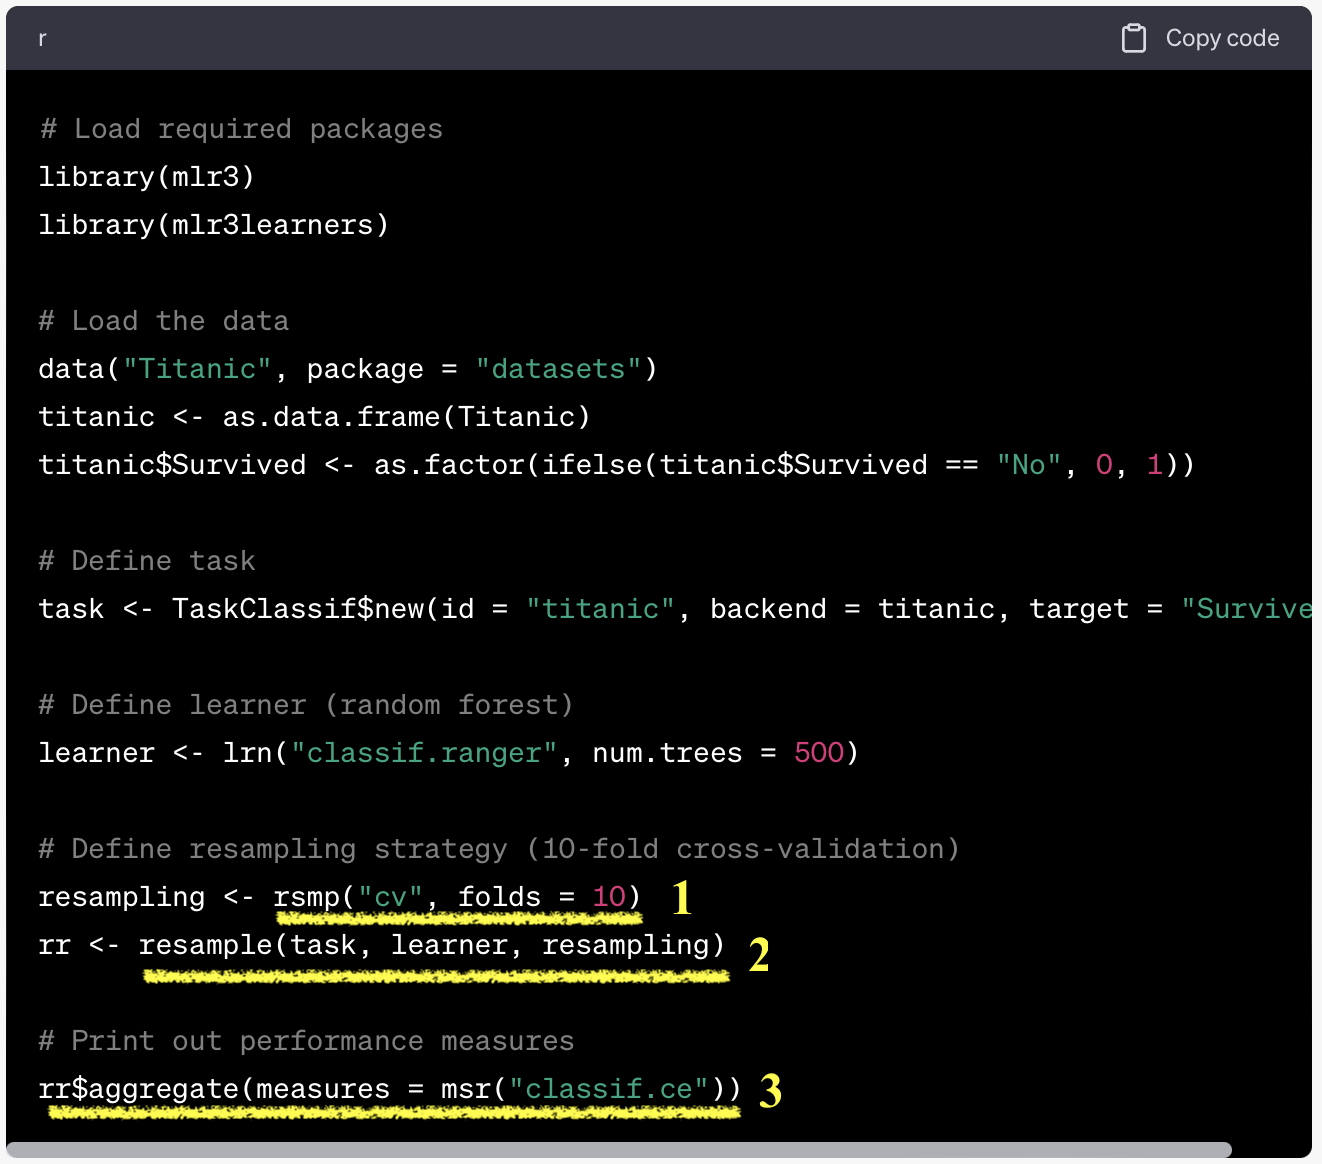
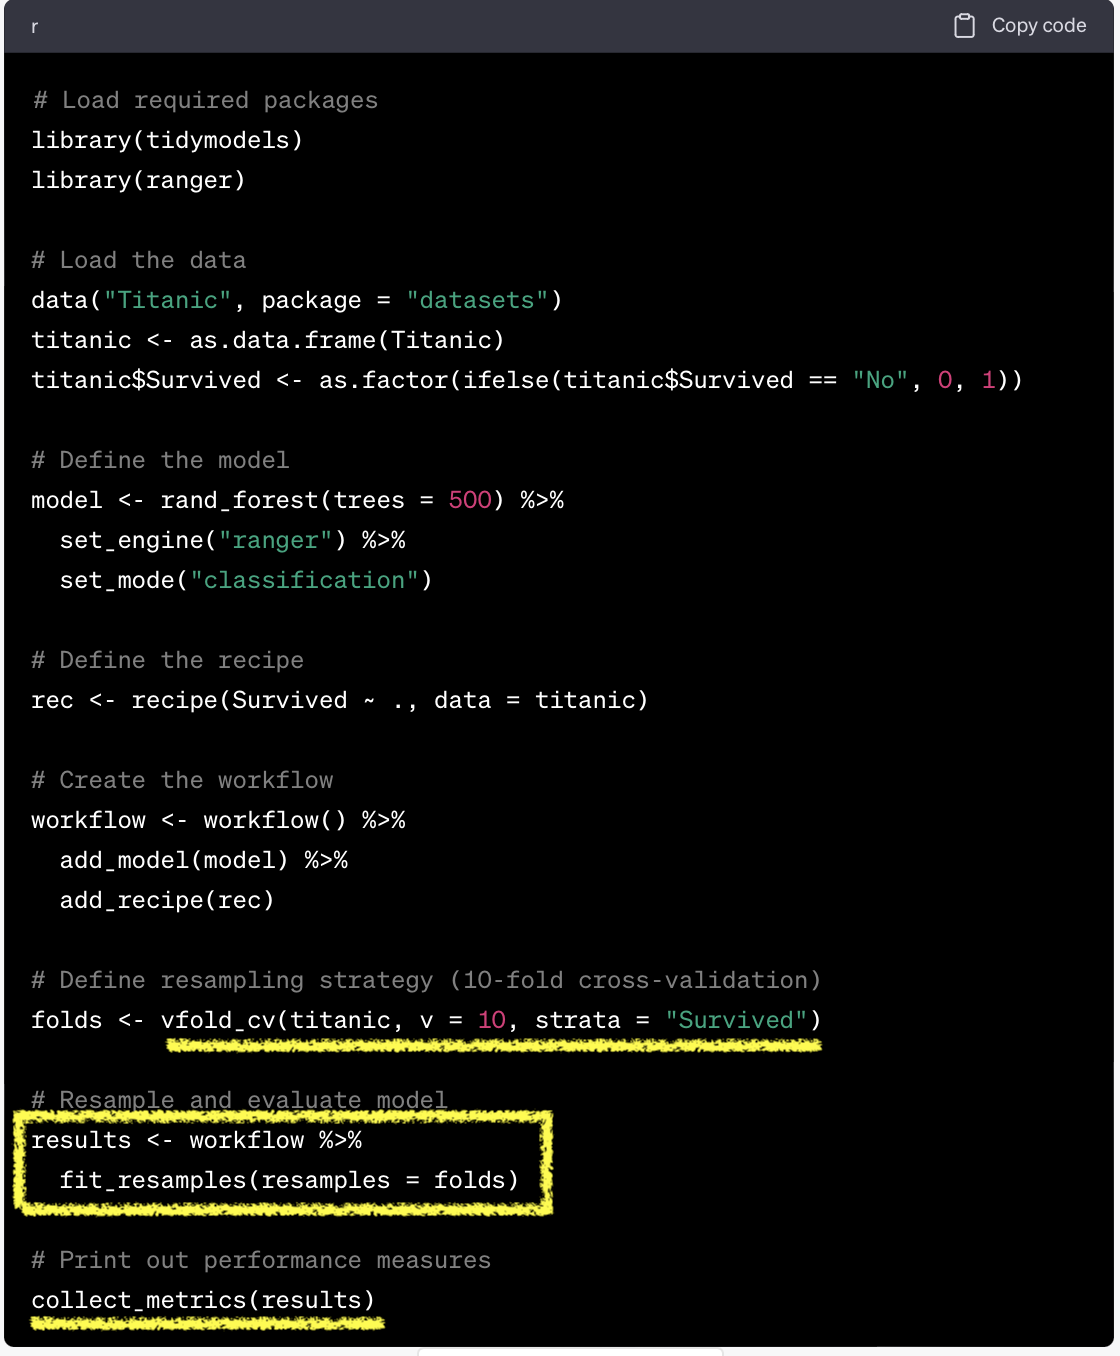
Resampling
- Dictionary:
mlr_resamplings - Sugar function:
rsmp()
# A tibble: 9 × 4
  key         label                         params    iters
  <chr>       <chr>                         <list>    <int>
1 bootstrap   Bootstrap                     <chr [2]>    30
2 custom      Custom Splits                 <chr [0]>    NA
3 custom_cv   Custom Split Cross-Validation <chr [0]>    NA
4 cv          Cross-Validation              <chr [1]>    10
5 holdout     Holdout                       <chr [1]>     1
6 insample    Insample Resampling           <chr [0]>     1
7 loo         Leave-One-Out                 <chr [0]>    NA
8 repeated_cv Repeated Cross-Validation     <chr [2]>   100
9 subsampling Subsampling <chr [2]> 30Resampling
resample(): initiate resampling$aggregate(): aggregate resampling performance
task = tsk("german_credit")
learner = lrn("classif.ranger", predict_type="prob")
resample = rsmp("cv", folds=10)
rr  = resample(task, learner, resample, store_model=T)
measures = msrs(c("classif.acc","classif.ppv","classif.npv","classif.auc"))
rr$aggregate(measures)
classif.acc classif.ppv classif.npv classif.auc
0.7610000 0.7818277 0.6598222 0.7952059 Resampling
plotting resampling results
Comparing performaces
mlr3 vs tidymodels

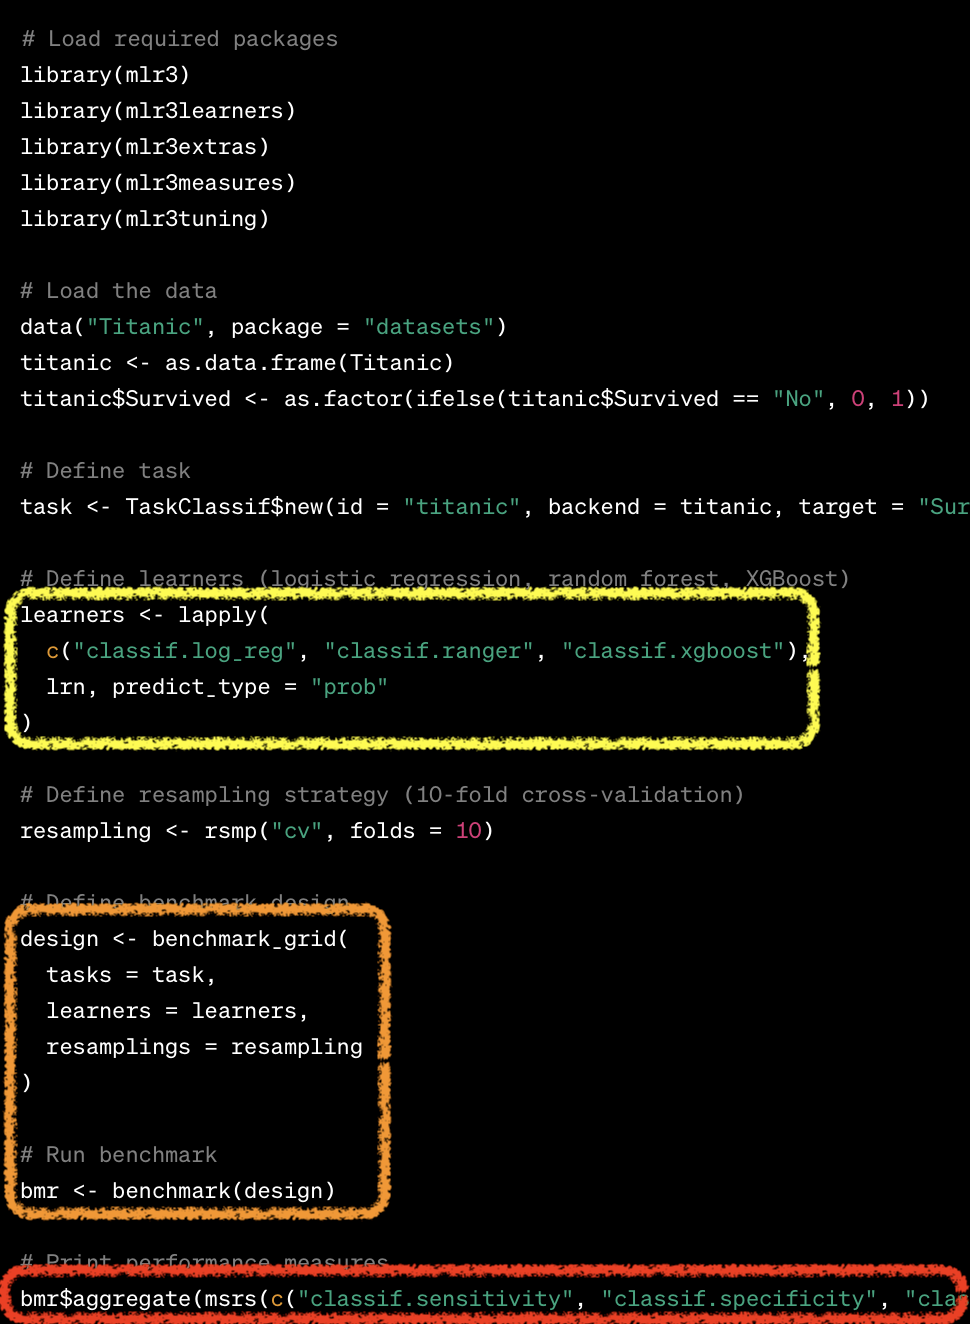
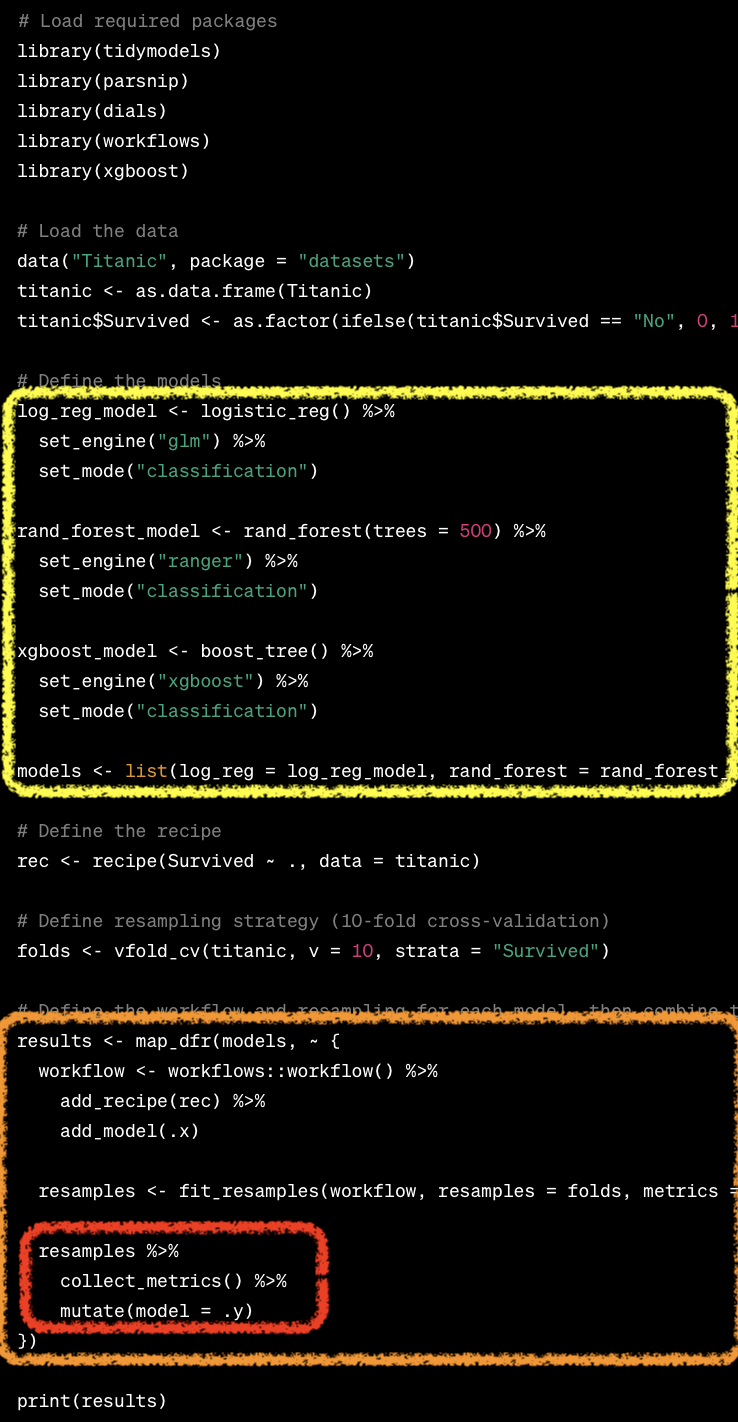
Benchmarking
- Comparison of multiple learners on a single task (or multiple tasks).
benchmark_grid(): design a benchmarking
tasks = tsks(c("german_credit", "sonar", "breast_cancer"))

learners = list(
  lrn("classif.log_reg", predict_type="prob", id="LR"),
  lrn("classif.rpart", predict_type="prob", id="DT"),
  lrn("classif.ranger", predict_type="prob", id="RF")
)

rsmp = rsmp("cv", folds=5)

design = benchmark_grid(tasks, learners, rsmp)
Benchmarking
benchmark(): execute benchmarking
bmr = benchmark(design)
measures = msrs(c("classif.acc","classif.ppv", "classif.npv", "classif.auc"))
as.data.table(bmr$aggregate(measures))
# A tibble: 9 × 10
nr resample_result task_id learner_id resampling_id iters classif.acc
<int> <list> <chr> <chr> <chr> <int> <dbl>
1 1 <RsmplRsl> german_credit LR cv 5 0.746
2 2 <RsmplRsl> german_credit DT cv 5 0.736
3 3 <RsmplRsl> german_credit RF cv 5 0.759
4 4 <RsmplRsl> sonar LR cv 5 0.736
5 5 <RsmplRsl> sonar DT cv 5 0.702
6 6 <RsmplRsl> sonar RF cv 5 0.831
7 7 <RsmplRsl> breast_cancer LR cv 5 0.917
8 8 <RsmplRsl> breast_cancer DT cv 5 0.940
9 9 <RsmplRsl> breast_cancer RF cv 5 0.969
# ℹ 3 more variables: classif.ppv <dbl>, classif.npv <dbl>, classif.auc <dbl>Benchmarking result
task = tsk("german_credit")
learners = list(
  lrn("classif.log_reg", predict_type="prob", id = "LR"),
  lrn("classif.rpart", predict_type="prob", id = "DT"),
  lrn("classif.ranger", predict_type="prob", id = "RF")
)
cv10 = rsmp("cv", folds=10)
design = benchmark_grid(task, learners, cv10)
bmr = benchmark(design)
autoplot(bmr, measure =msr("classif.auc"))
Benchmarking result
Pipeline operatros
Pipe operator
- Preprocessing with graph construction
- Dictionary:
mlr_pipeops - Sugar function:
po()
<TaskClassif:breast_cancer> (683 x 10): Wisconsin Breast Cancer
* Target: class
* Properties: twoclass
* Features (9):
  - ord (9): bare_nuclei, bl_cromatin, cell_shape, cell_size,
    cl_thickness, epith_c_size, marg_adhesion, mitoses, normal_nucleoli
gr = po("scale") %>>%
po("encode") %>>%
po("imputemedian") %>>%
lrn("classif.rpart", predict_type="prob")
gr$plot()
Or manually …
gr = Graph$new()
gr$add_pipeop(po("pca"))
gr$add_pipeop(lrn("classif.ranger"))
gr$add_edge("pca","classif.ranger")
gr$plot()
PipeOp: <pca> (not trained)
values: <list()>
Input channels <name [train type, predict type]>:
  input [Task,Task]
Output channels <name [train type, predict type]>:
  output [Task,Task]
Popular POs
| Class | Key | Description |
|---|---|---|
| PipeOpScale | “scale” | Scale features (µ=0, ∂=1) |
| PipeOpScaleRange | “scalerange” | Scale features (min=0,Max=1) |
| PipeOpPCA | “pca” | Principal component analysis |
| PipeOpImputeMean | “imputemean” | Impute NAs with mean |
| PipeOpImputeMedian | “imputemedian” | Impute NAs with median |
| PipeOpEncode | “encode” | Encode factor features |
| PipeOpClassBalancing | “classbalancing” | Balance imbalanced data |
Setting hyperparameter for pipeops
Resampling with graphs
And so on
- Hyperparameter tuning
- Feature selection
Summary
mlr3
R6,data.tablebased ML framework- Still in development
- A great textbook: mlr3book


