library(ggplot2)
dataA <- data.frame(
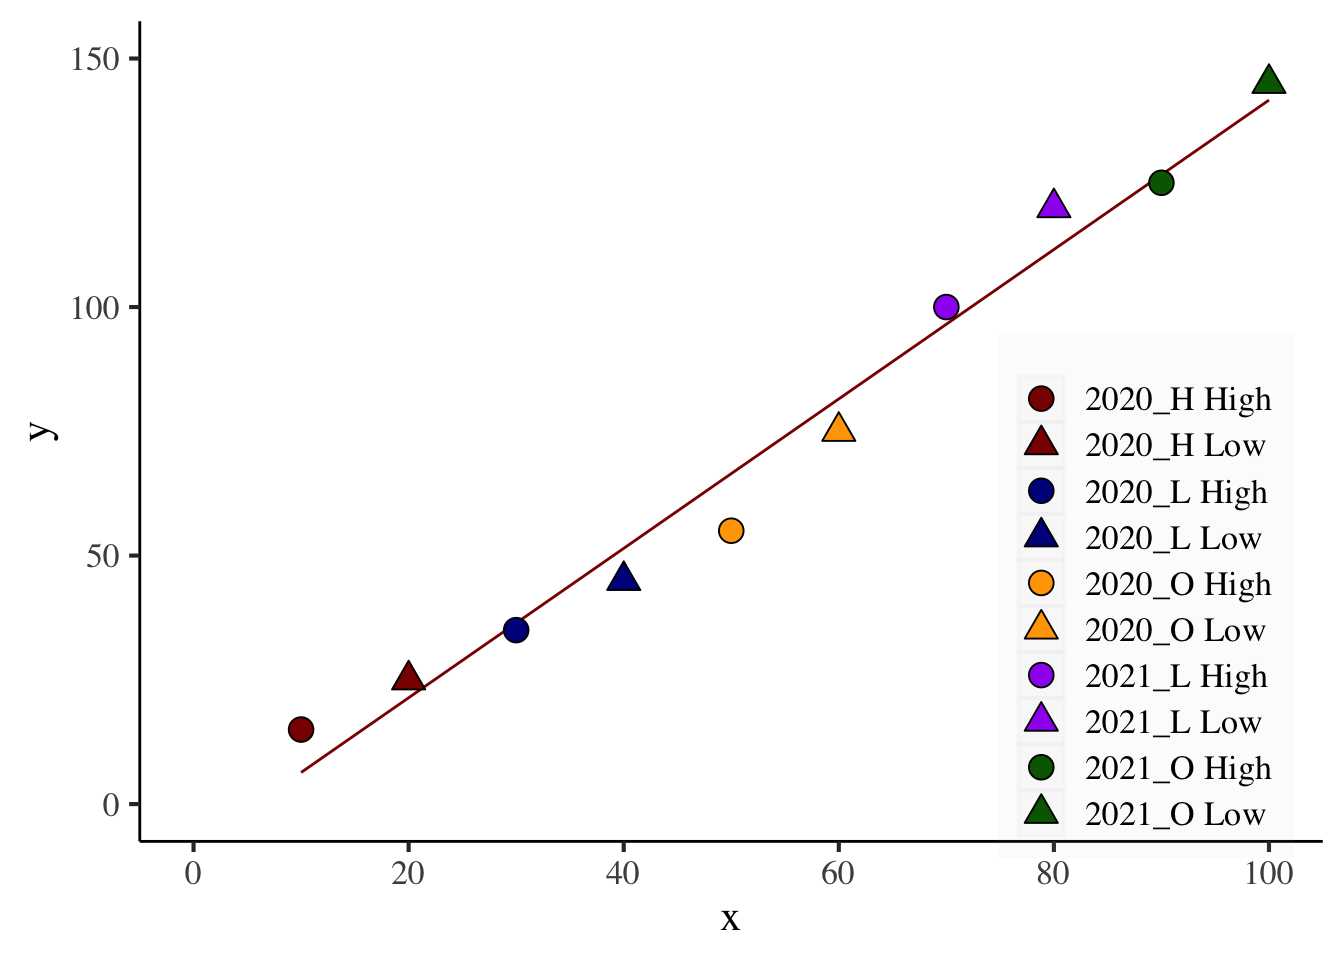
population=rep(c("High", "Low"), time=5),
year=rep(c("2020_H","2020_L","2020_O","2021_L","2021_O"), each=2),
x=c(10,20,30,40,50,60,70,80,90,100),
y=c(15,25,35,45,55,75,100,120,125,145)
)
dataA$group <- paste(dataA$year,dataA$population, sep=" ")
colors <- c("Dark red","Dark blue", "Orange", "purple", "dark green")
shapes <- c(21,24)
ggplot(data=dataA, aes(x=x, y=y))+
stat_smooth(method='lm', linetype=1, se=FALSE, formula=y~x, linewidth=0.5,
color="darkred") +
geom_point(aes(fill=group, shape=group), size=4) +
scale_fill_manual(values= rep(colors,each=2),
labels = dataA$group,
name= "Year & Pop.") +
scale_shape_manual(values= rep(shapes, 5),
labels = dataA$group,
name= "Year & Pop.") +
scale_x_continuous(breaks=seq(0,100,20),limits=c(0,100)) +
scale_y_continuous(breaks=seq(0,150,50),limits=c(0,150)) +
# guides(shape="none") +
theme_classic(base_size=16, base_family="serif")+
theme(legend.position=c(0.85, 0.3),
legend.title=element_blank(),
legend.key=element_rect(color=alpha("grey",.05), fill=alpha("grey",.05)),
legend.background= element_rect(fill=alpha("grey",.05)),
axis.line=element_line(linewidth=0.5, colour="black"))